Data analyst Ellie K talks you through the thought process behind data exploration.
As the data analyst here at ORCA, part of my job is coming up with interesting research topics and one important part of this is data exploration - a mini analysis if you like. Data exploration is useful to assess what the data shows, how might be best to analyse it and what other things we might need to consider in the full analysis. We thought it might be fun to shake up our usual content and talk you through this process in the form of blogs. My main interest is the role of environmental factors in shaping cetacean distribution (so expect a lot of that) but I may eventually cover more general, non-data analysis aspects of cetacean science too. One particularly interesting and topical species-environment relationship is the one that exists between cetaceans and changing ocean conditions and as a case-study, common dolphins in the northeast Atlantic are a great example.
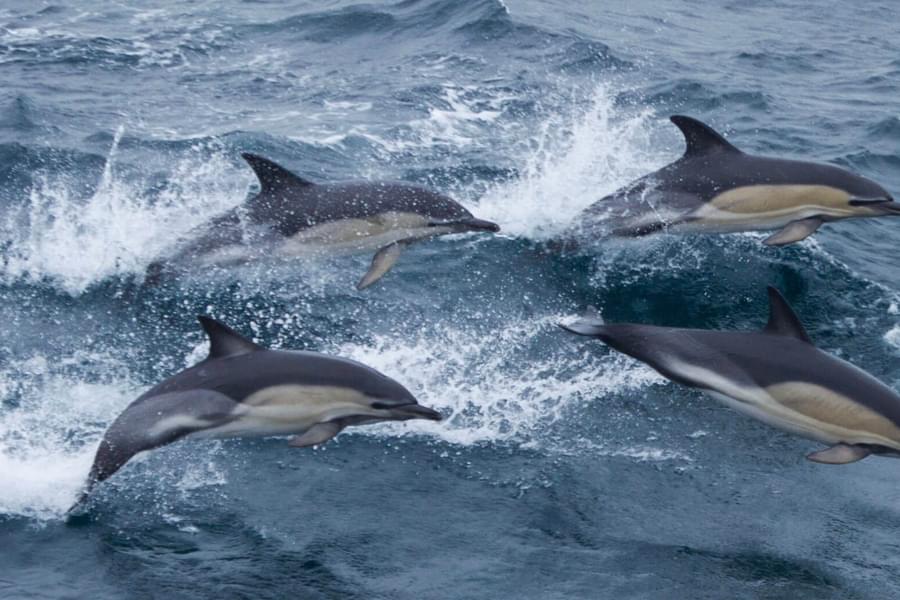
If you have been at sea more to the west of the UK and Europe, there is a good chance you will have seen some of these show-offs - common dolphins. Traditionally considered a warmer water species (1), it has been suggested that their range may be shifting northwards in response to warming oceans (2) with possible implications for the colder water white-beaked dolphin which occupies a similar ecological niche at the higher latitudes that common dolphins may be increasing in (2,3). There are also implications for the dolphins themselves, as changes in distribution could increase their exposure to human activities that are bad for them like getting caught in nets and with the associated risk of mortality (4), so clearly it is important to investigate changes in their abundance and distribution to better manage these activities. The main goal of our extensive data collection is to monitor these changes in location and abundance which begs the question: what does our dataset say about changes in common dolphins over time?
To be really sure that something is definitely happening, it helps to have a lot of data which increases our confidence that we have detected a real trend. This is why long term datasets, like the one we have here at ORCA, are crucial for investigating these kinds of questions.
Common dolphins have taken the spot for #1 most seen species in all years (except 2017) in our annual reports, which might indicate an increase in northwest Europe where the bulk of our data collection takes place. However, as our survey effort has expanded over the years and contracted quite a bit in 2020/21 (due to covid), it could be tricky to disentangle a real change from fluctuations in observation effort, i.e. whereabouts we were looking for dolphins and for how long. If you know how much effort you have though, it’s easier to account for these fluctuations in the analysis. You will have heard about recording effort information if you have done a Marine Mammal Surveyor or OceanWatchers training course, and this is exactly why we stress it so much. This is another thing that makes our data valuable and useful.
Enough of that though, have common dolphin sightings actually increased in ORCA’s dataset in recent years? Let’s explore.
Rough analysis
I used all of our northwest Europe survey data from 2006-2022, spanning a total of 16 years. I aggregated the survey effort in kilometres and common dolphin sightings into yearly chunks. As I said above, changes in search effort over time could confound the actual trend so it’s important to address this. I opted to include the amount of survey effort per year as an offset in the model which adjusts the number of sightings by how much survey effort there is.
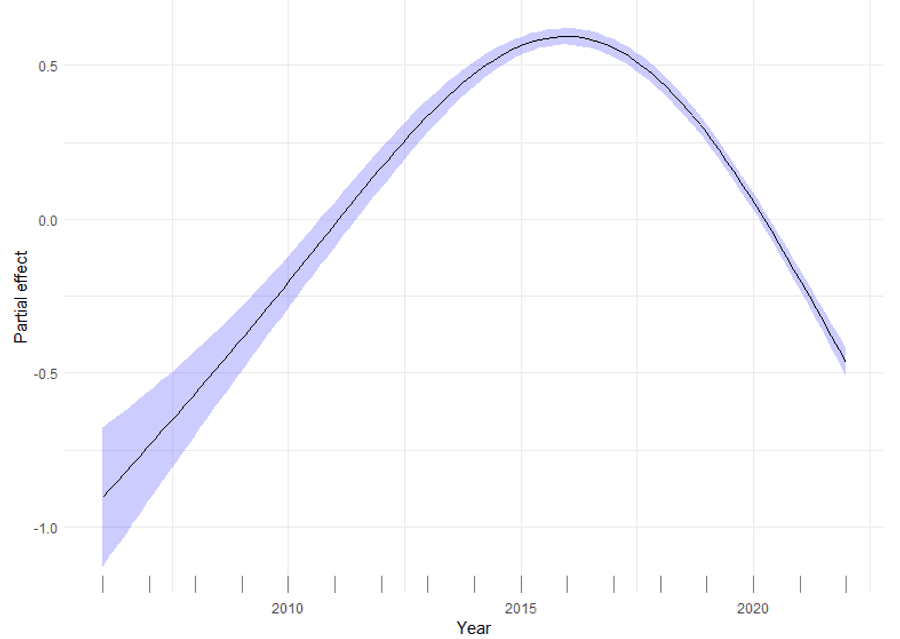
Inspecting the scattergraph of sightings and year, the relationship did not look like it would be described well with a straight line, so I opted to use a generalised additive model (GAM): a model that can fit curves to the data. GAMs can be very flexible and could try and match to every little up and down in the time series if we wanted it to, but as we are only interested in the general trend over time, I only let it be a little bit wiggly and limited it to four wiggles.
What I found
Have common dolphin sightings in our dataset increased over the years? Kind of, but not really. Once effort is accounted for, sightings from our data increased gradually until around 2015/2016.
What does it mean?
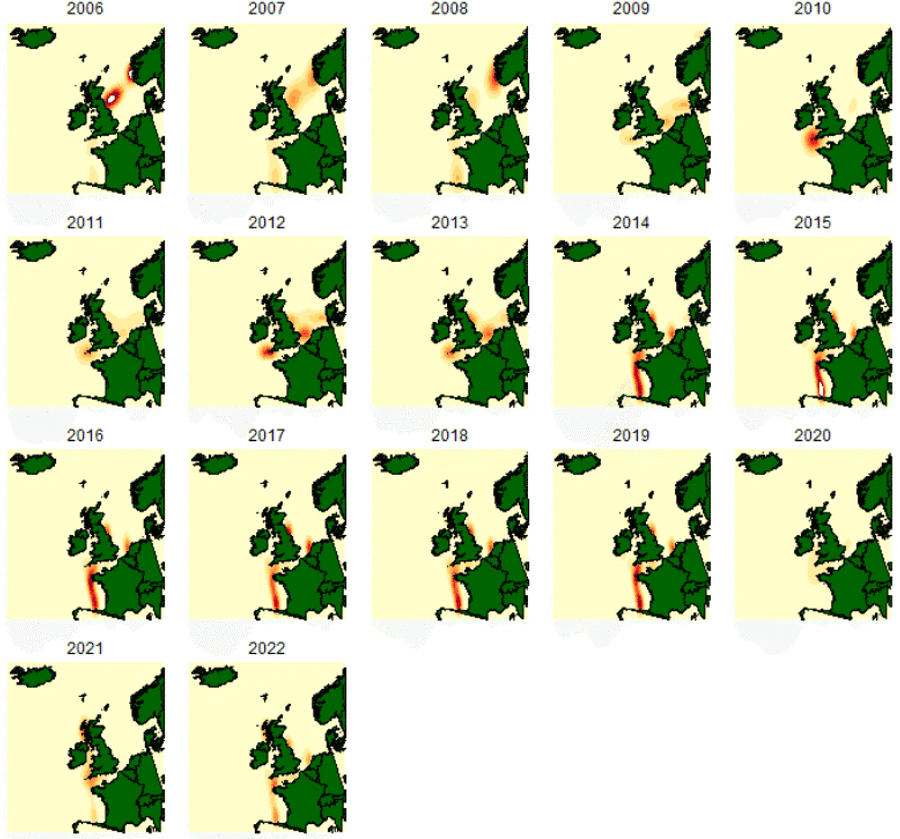
Before we jump to any conclusions here, there is at least one caveat to bear in mind. While I have (attempted to) account for changes in observation effort over time, this analysis does not consider geographical changes in effort. For example, at the start of the time series in 2006, most of our surveys were carried out in the northern North Sea which even today is not really a common dolphin hotspot, despite some evidence of an increase in the summer months in some areas (8, 9). Since then, it has increased more in core common dolphin areas such as the Bay of Biscay and Celtic Sea. In fact, the peak in the time series circa 2016 was around the time data collection by Ocean Conservationists (formerly known as Wildlife Officers) on ferries crossing the Bay of Biscay began in earnest with a minimum of two ships traversing the area multiple times per week between April and October, i.e. lots of survey effort in a known common dolphin hotspot in the months that the Bay of Biscay is swarming with them. See the below maps of the evolution of our survey coverage over time and notice the emergence of an effort hotspot in the eastern Bay of Biscay from 2014 onwards. Could this therefore suggest decreasing common dolphin presence in the offshore, warmish waters of the Bay of Biscay? We would need to take a different approach to examine this idea.
Speaking of the distribution of survey effort, ours tends to be quite far offshore, so this result is not necessarily inconsistent with an increase in common dolphins in recent years and could rather reflect an inshore shift of dolphins where they might be more noticeable. Indeed, a more thorough analysis of our ferry survey data has shown that common dolphin sightings during our ferry surveys increased in the shallow waters of the English channel between 2006 and 2017 which may lend some weight to the idea that common dolphin sightings have increased in shallower waters but we would need to look into the relationship between the depth or distance to the coast of common dolphin sightings and year to explore this idea.
What other factors might we need to take into account here? If it were climate change related, sea temperature would be an obvious one and common dolphin prey species (small fish) can be sensitive to temperature (10). The impacts of warming seas are quite complex however so it may not be as straightforward as the effect of temperature alone (11).
There are localised climate effects other than the global climate change to consider too. Here in the northeast Atlantic, one driver of climate variability is the North Atlantic Oscillation index (NAO). This is a measure of the pressure difference between the area of low pressure centred on Iceland (Icelandic low) and the area of high pressure centred on the Azores (Azores high) which determines the strength of westerly winds which in turn can affect the whole ecosystem from the bottom up (12). For anyone who is interested in that kind of thing, the references below will have more information on this, but this could be another factor to be accounted for when considering changes in common dolphin abundance over time.
There are also climate fluctuations at longer timescales, e.g. Atlantic Multidecadal Oscillation (13), that could also play a role, but as the name suggests this operates over multiple decades and as long term as our dataset is, it still only spans 16 years so we might not be able to detect fluctuations related to this factor just yet. Interestingly however, there is some evidence that AMO phase is associated with bluefin tuna abundance, a species which can frequently be observed feeding in association with common dolphins. Which makes you think!
Clearly, I have not included any of the above in the analysis so we can’t actually say anything about what might be behind the result. The most we can say is that it looks like common dolphin sightings peaked around 2016 in our dataset which in itself is still quite intriguing and could be a jump off point for further research.
Future directions?
The most obvious development from here is to start looking into whether there is a relationship with the potential drivers I mentioned above. It could also be interesting to see if indeed the increase is more in inshore areas by conferring with people who collect data closer to the coast, but that’s a whole blog topic of its own. Clearly accounting for the distribution of effort will also be important for any further research.
If you enjoyed this post and would like to collect data that enables these analyses and other projects, have a look at our training courses or even consider a small donation which will help our future research.
References
1 Perrin, W.F. (2018).Common dolphin (Delphinus delphis). In: Wursig, B., Thewissen, J.G.M. and Kovacs, K.M. eds. Encyclopedia of Marine Mammals 3rd edition
2.MacLeod, C.D., Bannon, S.M., Pierce, G.J., Svhweder, C., Learmonth, J.A., Herman, J.S. and Reid, R.J. (2005). Climate change and the cetacean community of north-west Scotland. Biological Conservation 124
3MacLeod, C.D., Weir, C.R., Begona Santos, M., and Dunn, T.E. (2008). Temperature based summer habitat partitioning between white-beaked and common dolphins around the United Kingdom and Republic of Ireland. Journal of the Marine Biological Association of the United Kingdom 88(6): 1193-1198
5 Murphy, S., Evans, P.G.H., Pinn,. E. and Pierce, G.J. (2019). Conservation management of common dolphins: lessons learned from the north-east Atlantic. Aquatic Conservation: Marine and Freshwater Ecosystems 2019: 1-30.
6 Wood, S.N. (2017) Generalised Additive Models: An Introduction with R (2nd
edition). Chapman and Hall/CRC.
7 Simpson, G.L., 2023. Gratia: graceful ggplot-based graphics and other functions for GAMs fitted using mgcv. R package version 0.8.1, URL:https://gavinsimpson.github.io....
8 Robbins, J.R., Babey, L. and Embling, C.B. (2020). Citizen science in the marine environment: estimating common dolphin densities in the north-east Atlantic. PeerJ 28:8
9 Robinson, K.P., Eisfield, S.M.,Costa, M., and Simmonds, M.P. (2010). Short-beaked common dolphin (Delphinus delphis) occurrence in the Moray Firth, north-east Scotland. Marine Biodiversity Records 3: e 55
10 Trenkel, V.M., Huse, G., MacKenzie, B.R., Alvarez, P., Arrizabalaga, H., Castonguay, M., Goni, N., Gregoire, F., Hatun, H., Jansen, T., Jacobsen, J.A., Lehodey, P., Lutcavage, M., Mariani, P., Melvin, G.D., Neilson, J.D., Nottestad, L., G.J., Oskarsson, G.J.,Payne, M.R., Richardson, D.E., Senina, I., Speirs, D.C. (2014). Comparative ecology of widely distributed pelagic fish species in the North Atlantic: implications for modelling climate and fisheries impacts. Progress in Oceanography 129:219-243.
11Thorne, L.H., Heywood, E.I. and Hirtle, N.O. (2022). Rapid restructuring of the odontocete community in an ocean warming hotspot. Global Change Biology 28 (22):6524-6540
12 Drinkwater, K.F., Belgrano, A., Borja, A., Conversi, A., Edwards, M., Greene, C.H., Ottersen, G., Pershing, A.J. and Walker, H. (2003). The response of marine ecosystems to climate variability associated with the North Atlantic Oscillation. Geophysical Monograph 134
13 Nye, J.A., Baker, M.R., Bell, R., Kenny, A., Halimeda Kilbourne, K., Friedland, K.D., Martino, E., Stachura, M.M., Van Houtan, K.S., Wood, R. (2014). Ecosystem effects of the Atlantic Multidecadal Oscillation. Journal of Marine Systems 133:103-116
14 Faillettaz, R., Beaugrand, G., Gobervlle, E. and Kirby, R. (2019). Atlantic Multidecadal Oscillations drive the basin-scale distribution of Atlantic bluefin tuna. Science Advances 5(1)